Features
The REST Plugin allows you to configure the Url of a swagger.json zo be used to determine the health of a running service. The found rest resources are then matched against implementations of the SwaggerEndpointInterpreter interface. Implementations can then decide if they check only the response status code or read the response to interpret the information. For example a /health endpoint may have a 200 status code but contain details on failed components.
Configuration
  "restServices": [
    {
      "swaggerUri": "https://${env}.host.domain/path/swagger.json",
      "serverName": "server_name_4",
      "applicationName": "application_name_4"
    },
    {
      "swaggerUri": "https://host.domain/path/swagger.json",
      "serverName": "server_name_1",
      "applicationName": "application_name_1",
      "environment": "ci"
    },
    {
      "swaggerUri": "https://host.domain/path/swagger.json",
      "serverName": "server_name_1",
      "applicationName": "application_name_1",
      "environment": "development",
      "additionalUris": [
        {
          "uri": "https://host.domain/path/to/healthcheck",
          "validationRegex": ".*\\{\"status\":\"SUCCESS\".*\"dependencies\".*\"name\":\"identity-redis\".*\"isAvailable\":true.*\"name\":\"storage-http\".*\"isAvailable\":true.*"
        },
        {
          "uri": "https://host.domain/path/to/healthcheck",
          "validationRegex": ""
        },
        {
          "uri": "https://host.domain/path/to/healthcheck"
        }
      ]
    }
]| Name | Description | Required | Default |
|---|---|---|---|
swaggerUri |
The uri that points to a swagger.json |
yes, if no additionalUris are specified |
empty |
serverName |
The server name that refers to the serverNames within the same screen, used to reference the position of this information block in the screen |
yes |
empty |
applicationName |
The application name that refers to the sub-row of the server name in the same screen. Used to reference the position if this information block in the screen |
yes |
empty |
environment |
Environment of this information block. Refers to the environments in the same screen. Used to reference the position in the screen (the column). |
yes, unless ${env} or ${stage} is used in the swagger uri. The screen will then iterate over all environments configured in this screen and create an information block per environment. ${stage} will be replaced with the stage name for the environment from environment-mappings.json (see below) |
empty |
additionalUris |
A list of uris to be checked against the response status code or an optional regular expression |
no |
empty |
Configuration of networks and environments
Reaching REST services might not be possible in every scenario. Typically a company defined network zones. And depending on where you deploy your software, services are reachable or they are not.
Polling for healthiness of unreachable services makes no sense. So there is a configuration file that allows describe this.
In an example: imagine 3 network zones: development, testing, production. You can only access services in the same zone or in the previous one. So the Mobitor running in development may only check services in development, but the one deployed in the production zone (typically an administration sub-zone) can reach all zones.
To simplify configuration the EnvironmentsConfigurationService (and the DefaultEnvironmentsConfigurationService) exists.
As seen above you can use an ${env} variable to not have to configure the same thing per stage or environment. But to allow
the Mobitor to filter out what cant be reached the interface and config file below exist.
What you specify in the configuration file is:
- what environment / stages are there
- in what network zone are they
- is there another domain suffix for the swagger uris that needs to be replaced. If using the ${env} variable above
the domain names for another environment or network zone may change. There is a configuration what needs to be replaced.
If there are no matching conventions every environment and stage must be configured manually by not using ${env}
and specyfing the "environment" attribute.
- is an environment reachable from localhost (used to prevent that local development polls everything)
See example in the test sources.
[
  {
    "environment": "build",
    "buildEnvironment": true,
    "name": "build",
    "stage": "build",
    "label": "Bake",
    "description": "Example Description",
    "descriptionUrl": "",
    "network": "ci",
    "pipeline": "any"
  },
  {
    "environment": "Y",
    "name": "ci-y",
    "stage": "ci",
    "label": "CI",
    "description": "Example Description",
    "descriptionUrl": "",
    "network": "development",
    "reachableFromLocalhost": true,
    "configDomainMappings": [
      {
        "configDomain": ".lb.domain",
        "realDomain": ".loadbalancer.host.domain"
      },
      {
        "configDomain": ".k8s.domain",
        "realDomain": ".kubernetes.host.domain"
      }
    ],
    "pipeline": "conventional"
  },
If this model of zones and stages does not fit your situation simply implment your own EnvironmentsConfigurationService as the default implementation will be disabled if there is another one.
Result

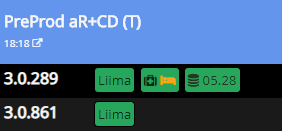
The information block shows a health-suitcase. If you click on it you can see a list of the rest resources that have been probed and any message added by its interpreter (see above). If a flyway/version/current resource is found, the database version is added as a separate block.
If a bed icon appears, then an interpreter marked a rest resource as too slow.
