The Mobitor contains Spring Boot actuator and uses its prometheus exporter to publish certain metrics, both technical ones as well as metrics collected by plugins.
The Prometheus path is: /mobitor/actuator/prometheus
The technical metrics are the ones like memory usage or thread counts. But also the metrics of the integrated Hazelcast cache are exported.
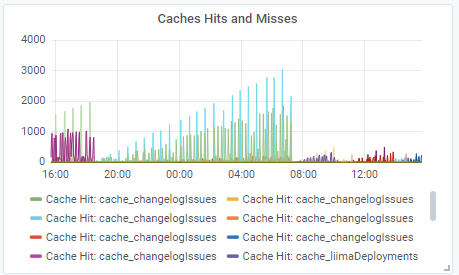
Figure 1. Chache Hits
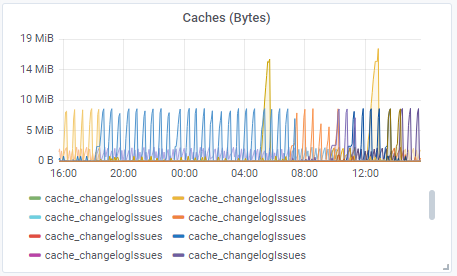
Figure 2. Chache Size
The plugins may also publish some data, like the duration it took to collect the data or collected errors:
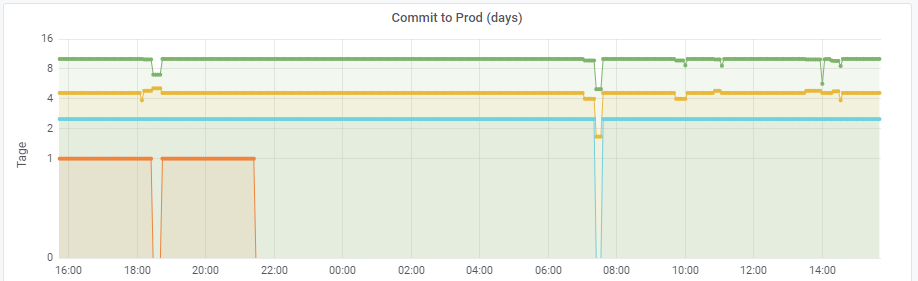
Figure 3. Commit to Deploy Statistics (BitBucket plugin)
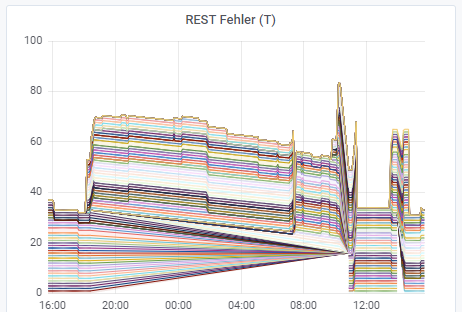
Figure 4. Errors on REST resources (REST Plugin)